 Like many of you who develop on the Mac, I was amazed and very impressed by the WebKit team’s Web Inspector tool when it was unveiled in January. However, it was clearly not yet complete… two critical tabfulls of data were missing, which kept me turning to other tools—like the excellent Firebug for Firefox—when getting into a serious debugging session.
Well, tonight I was delighted to discover that the wait is over! On downloading a new build of WebKit today, I found that Web Inspector finally can provide those critical Metrics and Properties of each DOM element on my web pages. And boy, have they done a great job in the implementation! Every bit as cool and functional as the original bits, so I can now get all the details on any element of the page with a right-click of my mouse (control-click for some folks) and a simple selection of “Inspect Element.” Now come on Firebug fans, don’t you wish you could inspect an element that easily? Not that it’s hard with Firebug, but I always say, “Save a millisecond here and a millisecond there, and pretty soon you’ve saved a whole second!” (Just kidding… I never said that before.) ![]()
Seriously, though, Web Inspector’s chief virtues—the characteristics that have made me anticipate this day for so long now—are its ability to let me quickly focus on one part of a page at a time, and to just as quickly and easily expand the scope of my focus to take in a larger context.
So what the heck does that mean? Simply that if I want to see the properties, metrics, attributes, and so on of a particular DIV on my page, I just right-click on it and select “Inspect Element” from the contextual menu. At that point, Web Inspector displays a really useful DOM tree that I can navigate, but it doesn’t show me the whole dang tree! Typically, Web Inspector shows the element I’m inspecting, and its context up to the second parent. Usually, that’s quite enough context to get the picture I need, but if I need more, it’s child’s play to expand the context up the DOM tree, one parent at a time.
Another way to quickly focus is to search. No other tool has a search feature like Web Inspector’s, and it alone will keep me glued to WebKit for development from now on. (Or until another tool matches or beats it, anyway!) The search field lets me find text from the page content, or—and here’s the really cool part—I can enter any id, class name, HTML element… basically, any DOM node and its attributes. The results list shows each blade of code that matches the search, not the entire code meadow. To see the context for any line, I simply select it and then clear the search field. Ta da! My node is highlighted in context with its brothers and sisters (and parents and cousins). Could hardly be simpler.
 But this part is nothing new… it’s been a basic part of Web Inspector since it was launched. What’s new are the Metrics and Properties tabs.
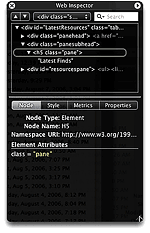
Web Inspector has four tabs of data: Node, Style, Metrics, and Properties. Combined, they comprise the entire set of attributes that are obtainable for any DOM node on the page. The Node tab has your basic Node name and the other attributes of your selected node. For example, selecting an anchor node will show you the HREF attribute.
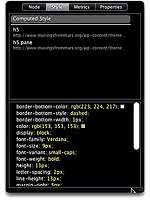
 The Style tab has been my favorite up to now… Here, you can see the computed style of the selected DOM node. Notice my emphasis on “computed.” Unlike any other tool except for the terrific Xyle scope, the Web Inspector Style tab shows not only the style as it is finally rendered by the browser, but all of the style declarations in my CSS file that were evaluated in determining that style. This is really useful information when you’re trying to debug CSS. Firebug and other tools show the computed style, but not the “raw” CSS code as well.
But oh, how I’ve missed the Metrics and Properties tabs!
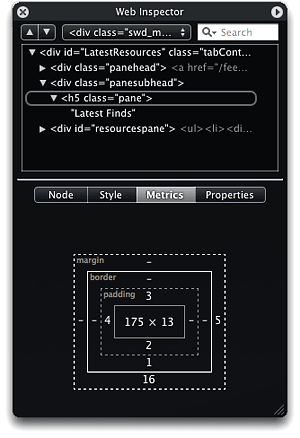
The new Metrics tab shows the information that in Firebug appears in the Layout tab, although naturally Web Inspector comes up with a cool new… and very intuitive… presentation method that I haven’t seen before. Metrics presents each node as a rectangle containing the node’s height and width attributes (if  it has such). That rectangle is surrounded by three more concentric rectangles with other metrics. The first shows the padding measurements, followed by the border and finally the margin measures. Take a look at the screenshot… much easier than trying to envision it from my lame description. Needless to say, this is going to be a big hit with me!
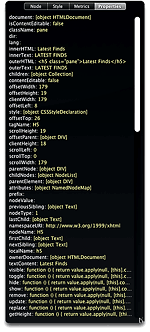
The Properties tab is the catch-all category that has everything else you want to know about the element: innerHTML, offsetTop, scrollHeight, clientWidth, and all the rest. It’s a nice, compact presentation that’s much easier on the eyes and mind (speaking for myself!) than, say, Firebug’s DOM tab. (Some of these measures appear conveniently in Firebug’s Layout tab along with the node’s metrics.)
So… all I can say is “Thanks, WebKit team! This has made my day!”
But before the wise WebKit ones get too relaxed and doe-eyed from my praise, I do have to close by asking, “So… When will it be available for Safari?”


